Stats for the big races

JWorm Racing Stats

JWorm Racing provides stats for big races. From track biases, to pace scenarios, all the way to a full Kentucky Derby Handicapping Guide. Keep coming back to find updated stats for the big race.

Monthly recap

August 2026 Top Picks
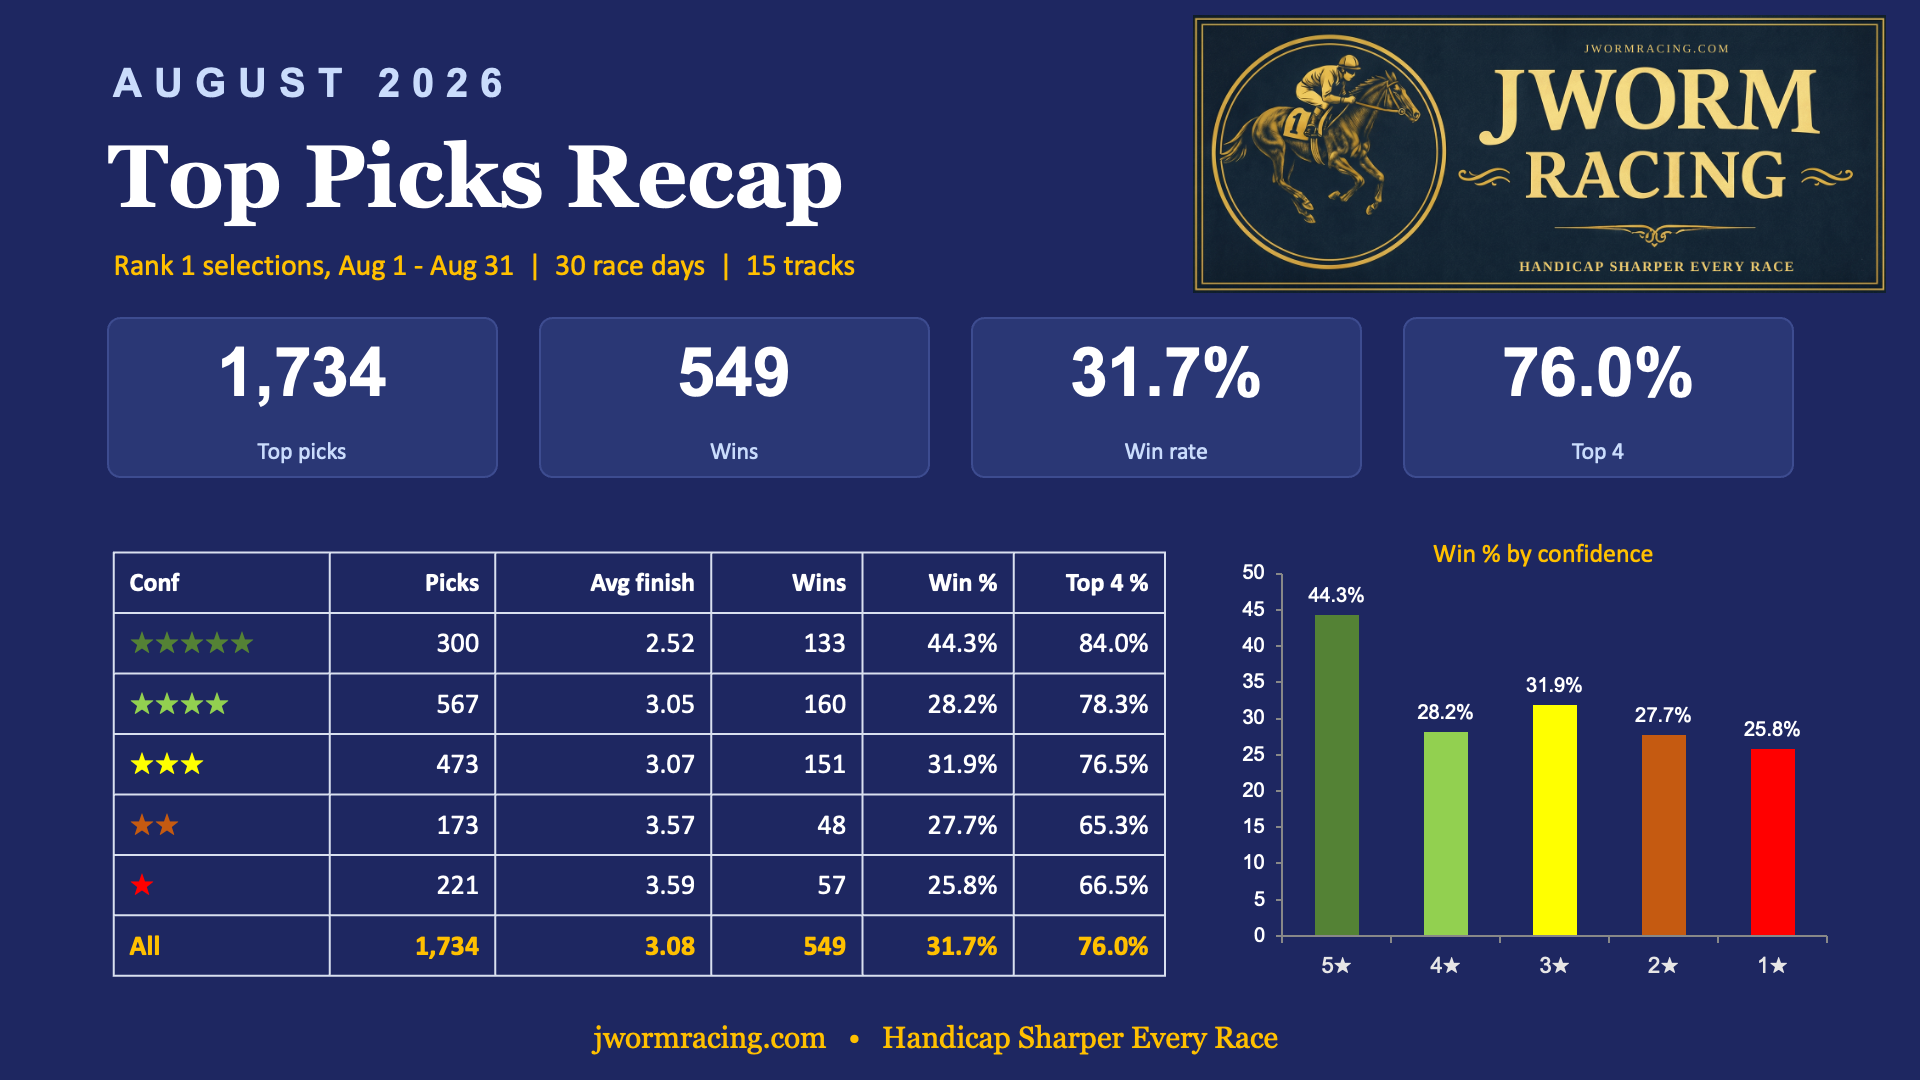
August 2026 Top Picks Recap: 1,734 rank-1 top picks across 30 race days and 15 tracks, 549 wins, 31.7 percent win rate, 76.0 percent top 4. Win rate by confidence: 5 star 44.3 percent, 4 star 28.2 percent, 3 star 31.9 percent, 2 star 27.7 percent, 1 star 25.8 percent.
Slideshow

Featured Stats Deck

The spa

Saratoga Shipper Analysis

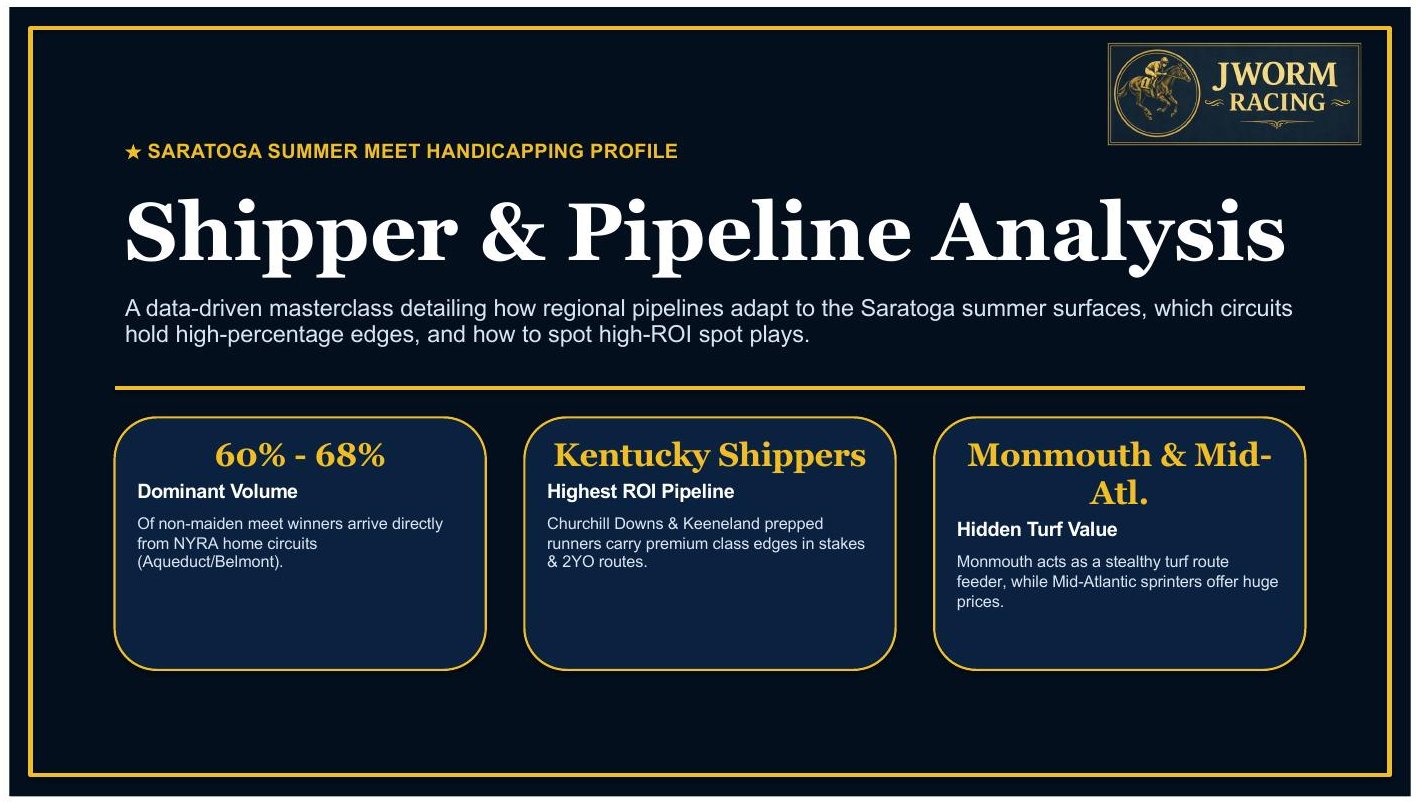
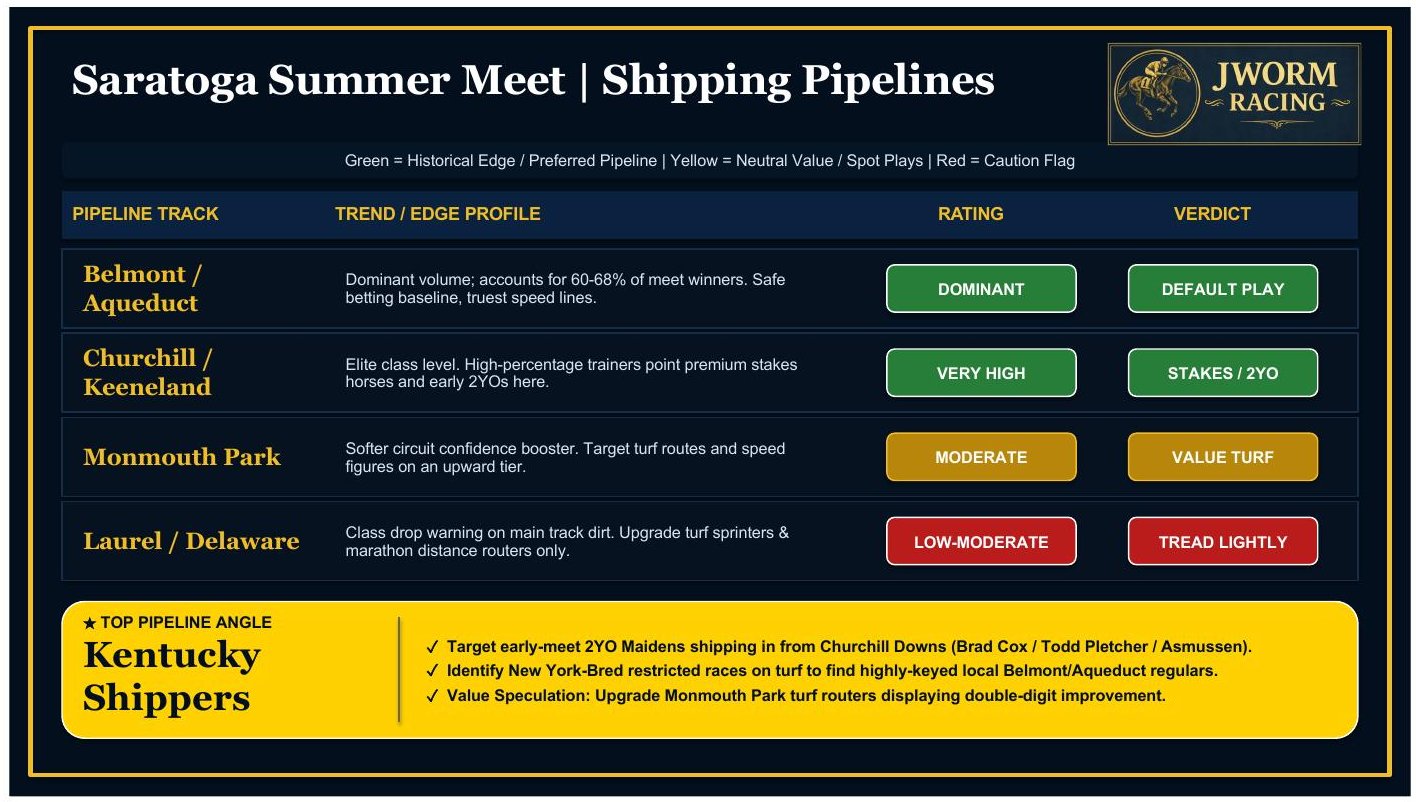
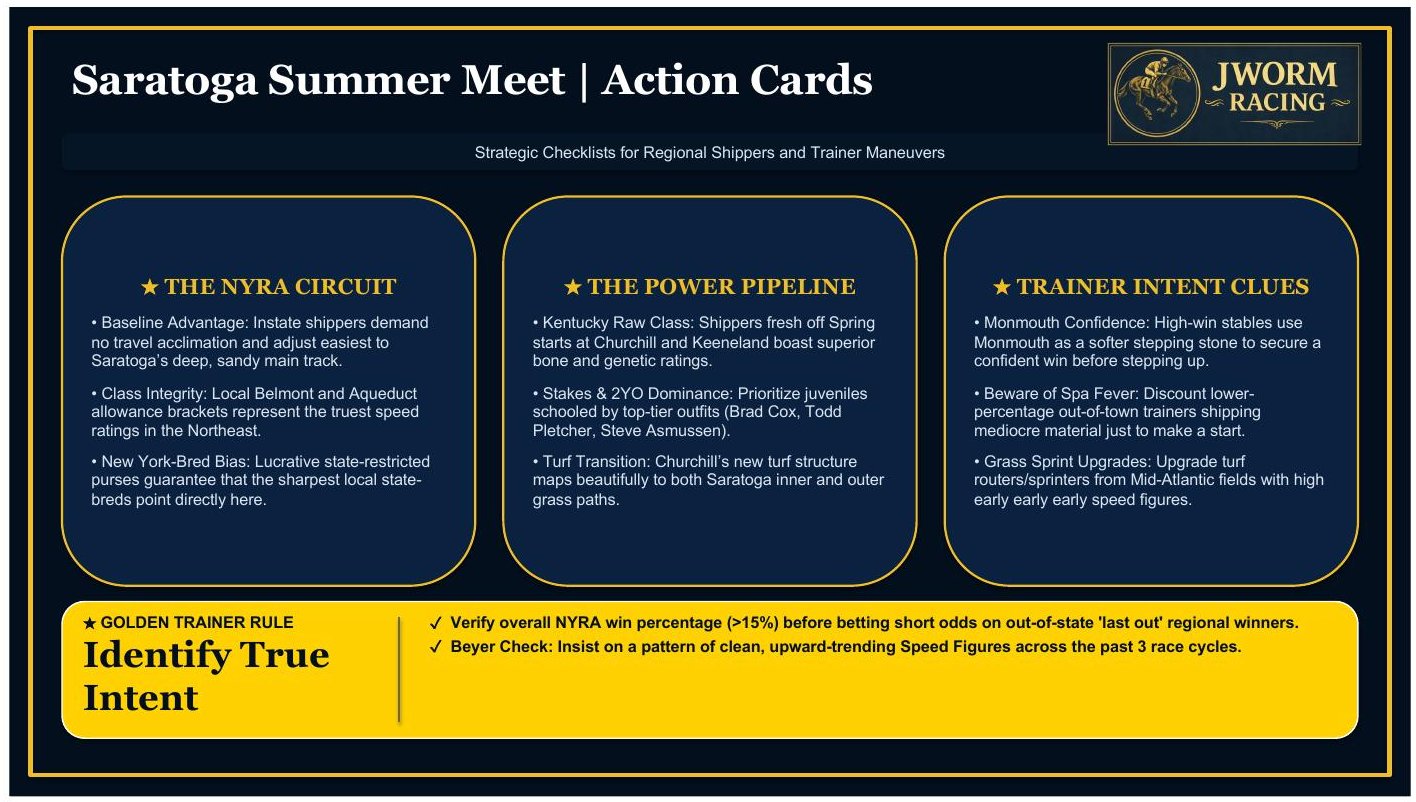
Saratoga Shipper and Pipeline Analysis: 60 to 68 percent of non-maiden meet winners arrive from NYRA home circuits; Kentucky shippers are the highest-ROI pipeline; Monmouth and Mid-Atlantic offer hidden turf value. Saratoga shipping pipelines rated: Belmont/Aqueduct dominant, Churchill/Keeneland very high for stakes and 2YOs, Monmouth moderate for turf value, Laurel/Delaware tread lightly — with the Kentucky Shippers top angle. Saratoga action cards: NYRA circuit baseline, the Kentucky power pipeline, trainer intent clues, and the golden trainer rule — identify true intent.
Track bias

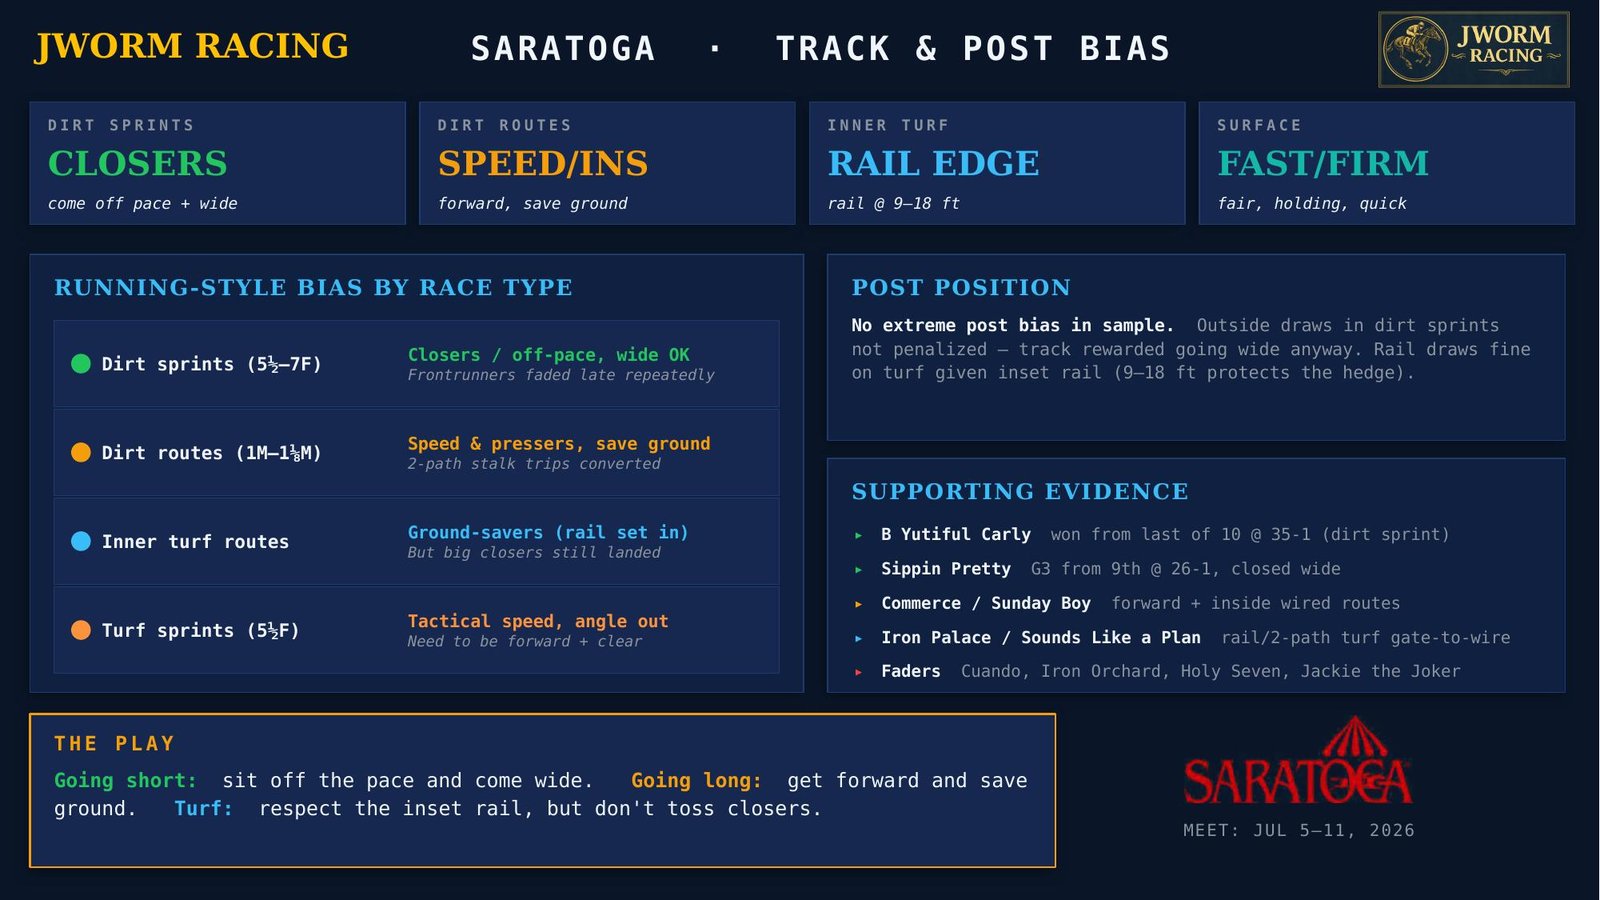
Saratoga Early Meet Track Bias

Saratoga early meet track and post bias chart
Track bias

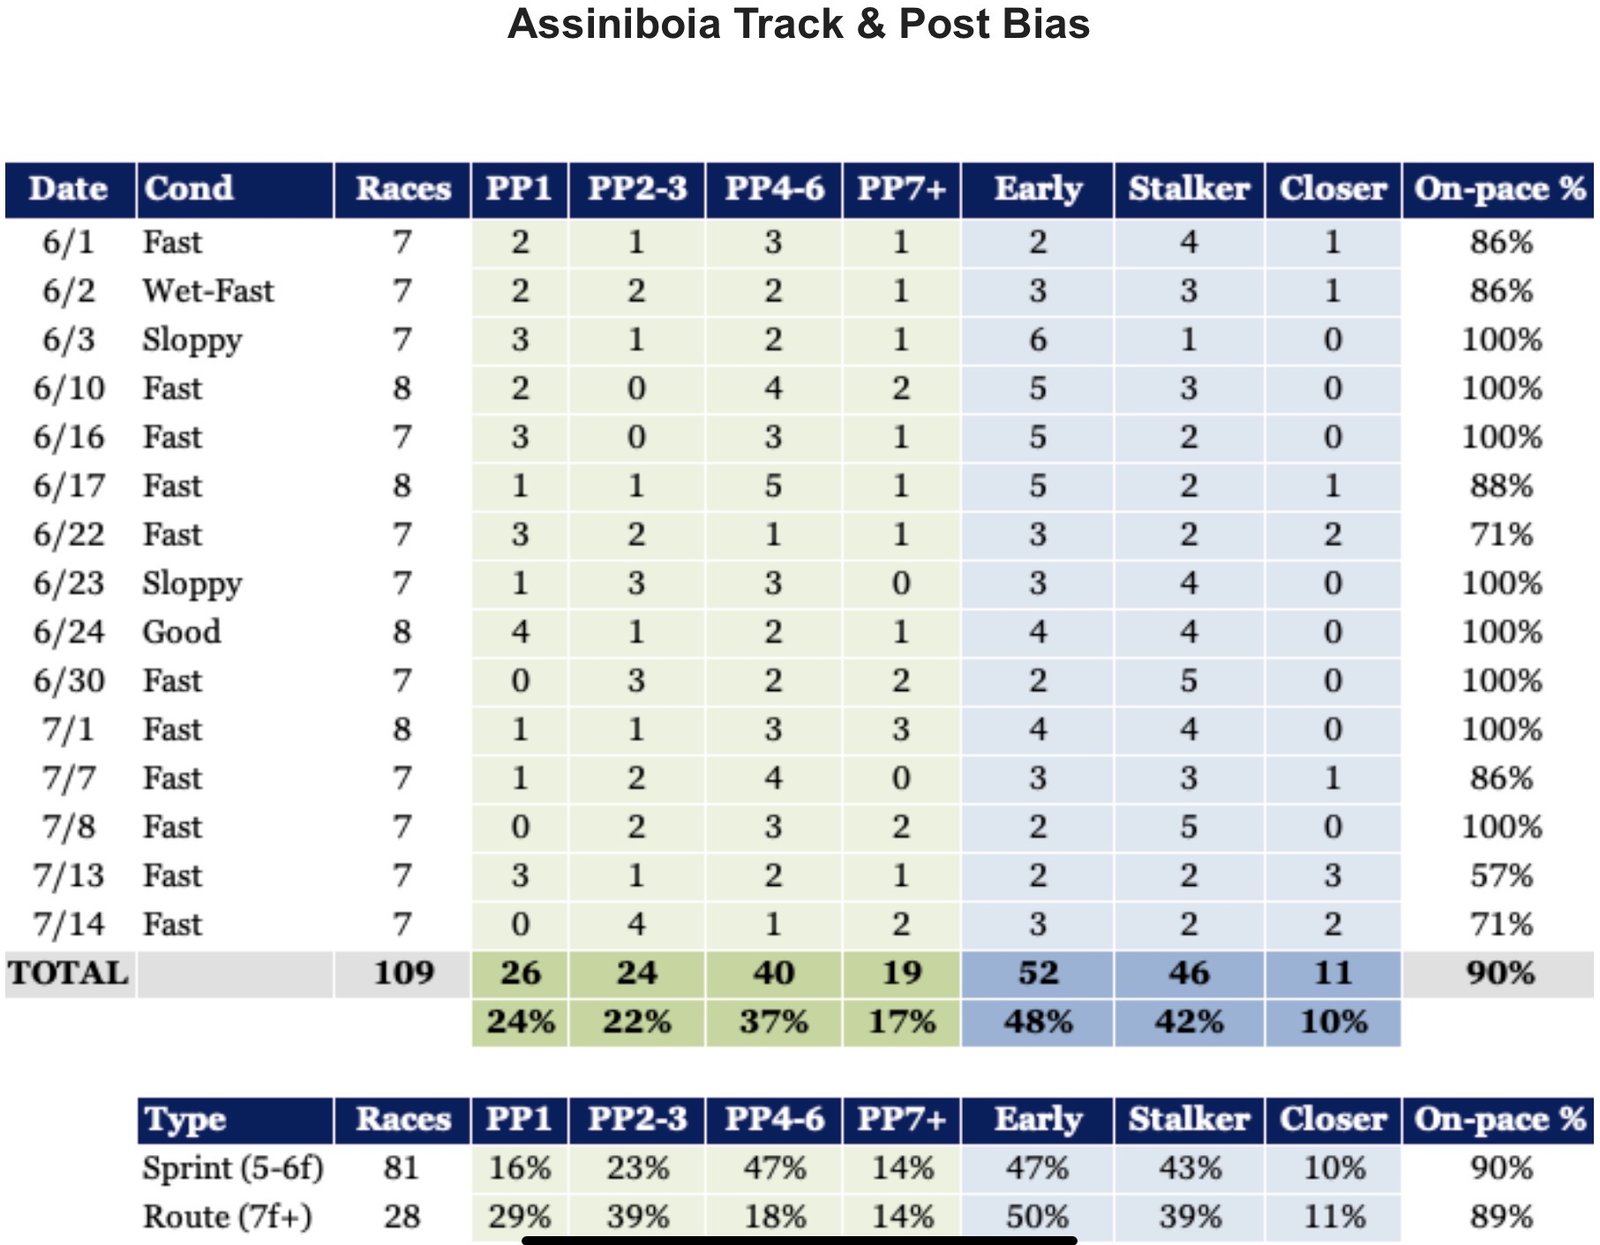
Assiniboia Track & Post Bias

Assiniboia track and post bias: 130 races June 1 through August 3 — post position and run style win counts by day, with sprint and route breakdowns. Early runners won 49 percent, on-pace 89 percent.